- Help Center
- Measures and Charts
- Manage your charts
Adding notes to a chart
Creating, adding and saving notes to a chart
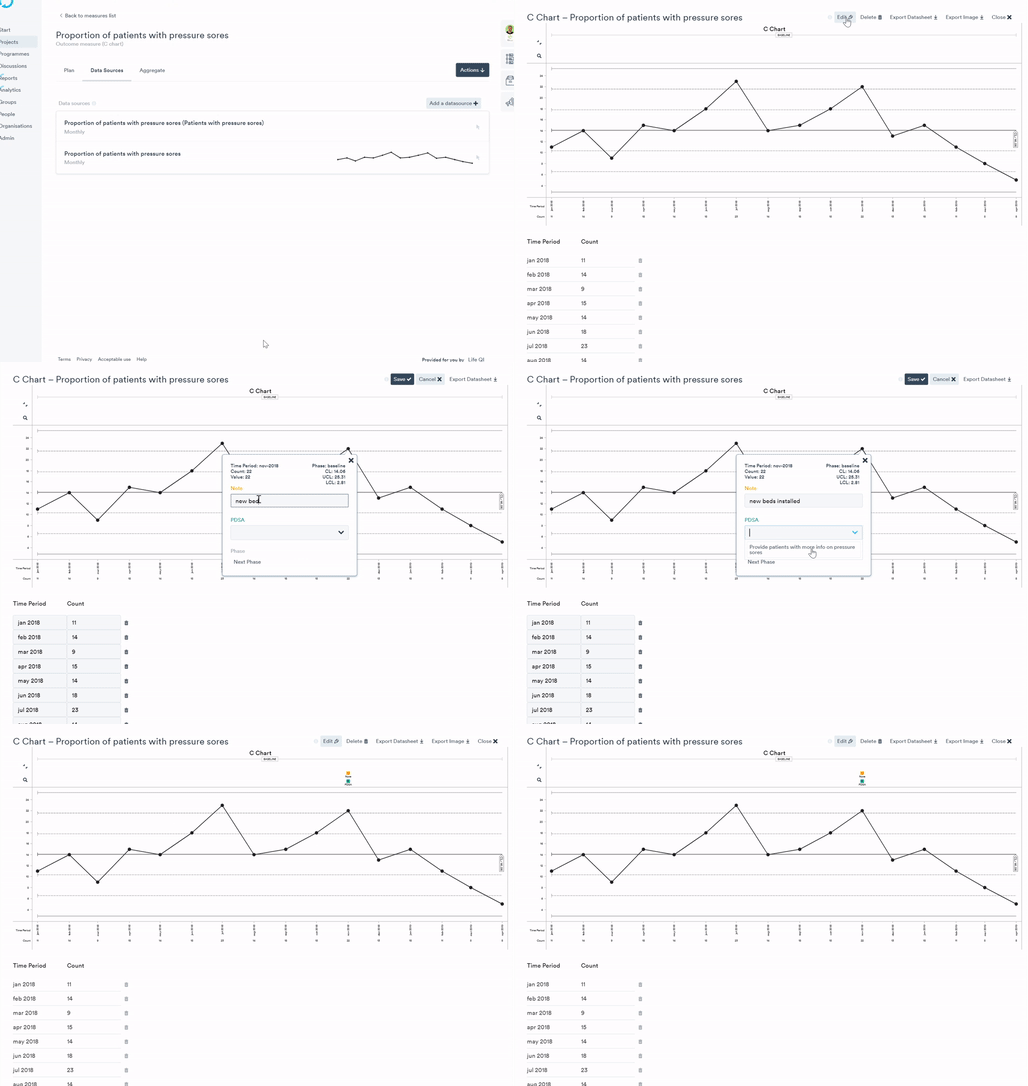
As well as creating simple annotations and descriptions, notes can be used to offer explanations of particular trends or unusual data points (outliers). For example, an unusually high influx of patients on a particular day may affect the results, causing an outlier.
Creating a note
1. Put the chart into edit mode by clicking the 'Edit' button.
2. Select the data point that you wish to annotate and then click 'Add Note'.

3. A simple text window will appear. Type in your note and click 'Save' on the data point pop-up before exiting.
4. Once you've added the note, make sure you put the chart back into view mode by clicking the 'Save' button next to the chart title.