Input data direct to a chart or copy from Excel
There are two ways to add data to your chart:
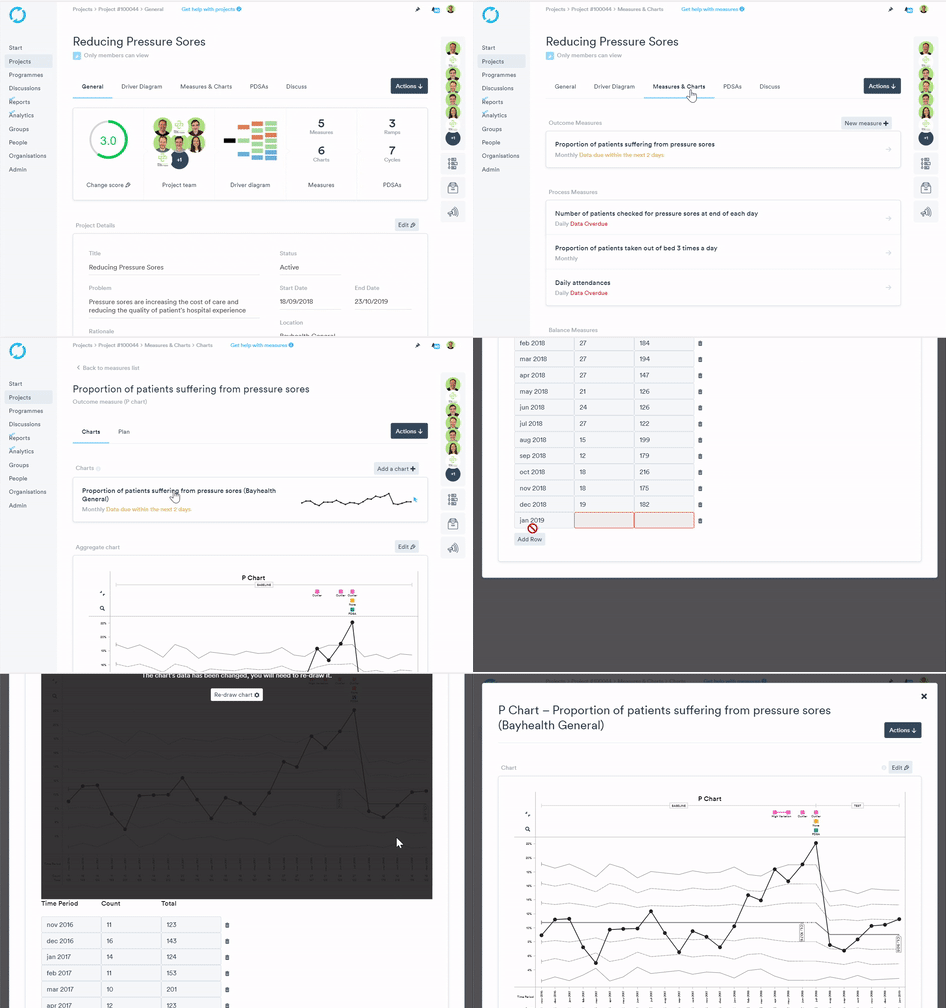
How to manually add data to a chart row by row
1. Select your project
2. Click Measures & Charts
3. Click the Measure
4. Click the Chart
5. Click Edit
6. Scroll down the screen and edit your data
7. Click the 'Save' button at the top of the Chart. Your Chart will then update with the new data point(s).

Copying and pasting from a spreadsheet into the datasheet
If you have large quantities of data and have already recorded your data in a spreadsheet, you can copy and paste your data directly from the spreadsheet. To do this you need to make sure that the spreadsheet columns match those specified on the datasheet. Each chart type has a different set of data columns, so you need to make sure the order on the Life QI datasheet and your spreadsheet match. You must paste in complete rows, so make sure you have data in each cell for the rows you wish to paste in. To copy and paste the data into your datasheet:
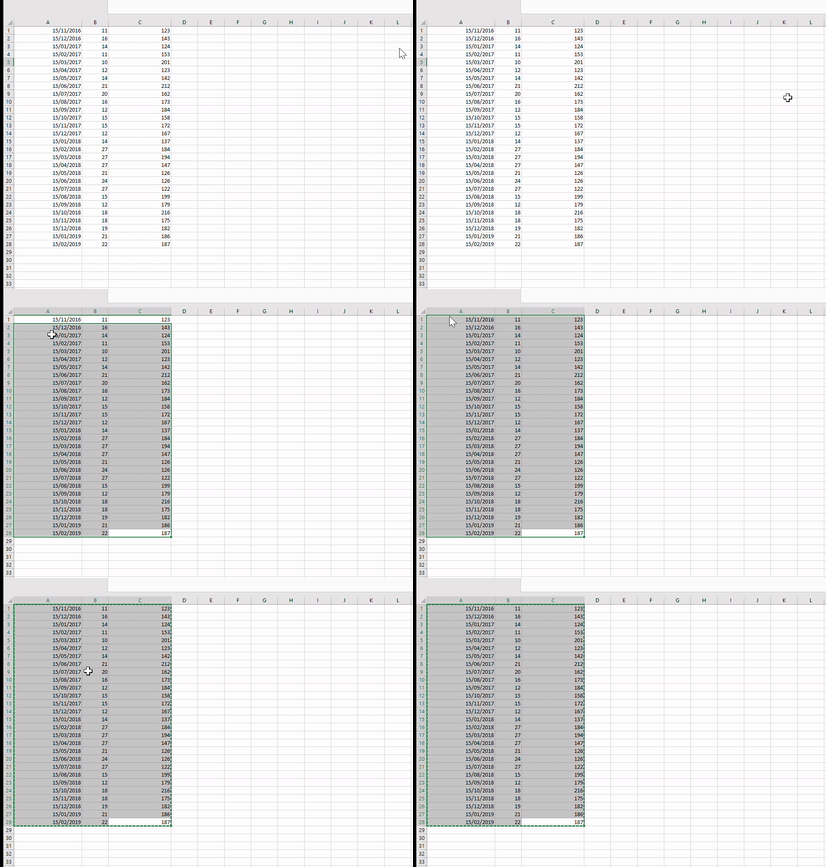
In the spreadsheet, select the rows that you want to include in your chart. Copy them.
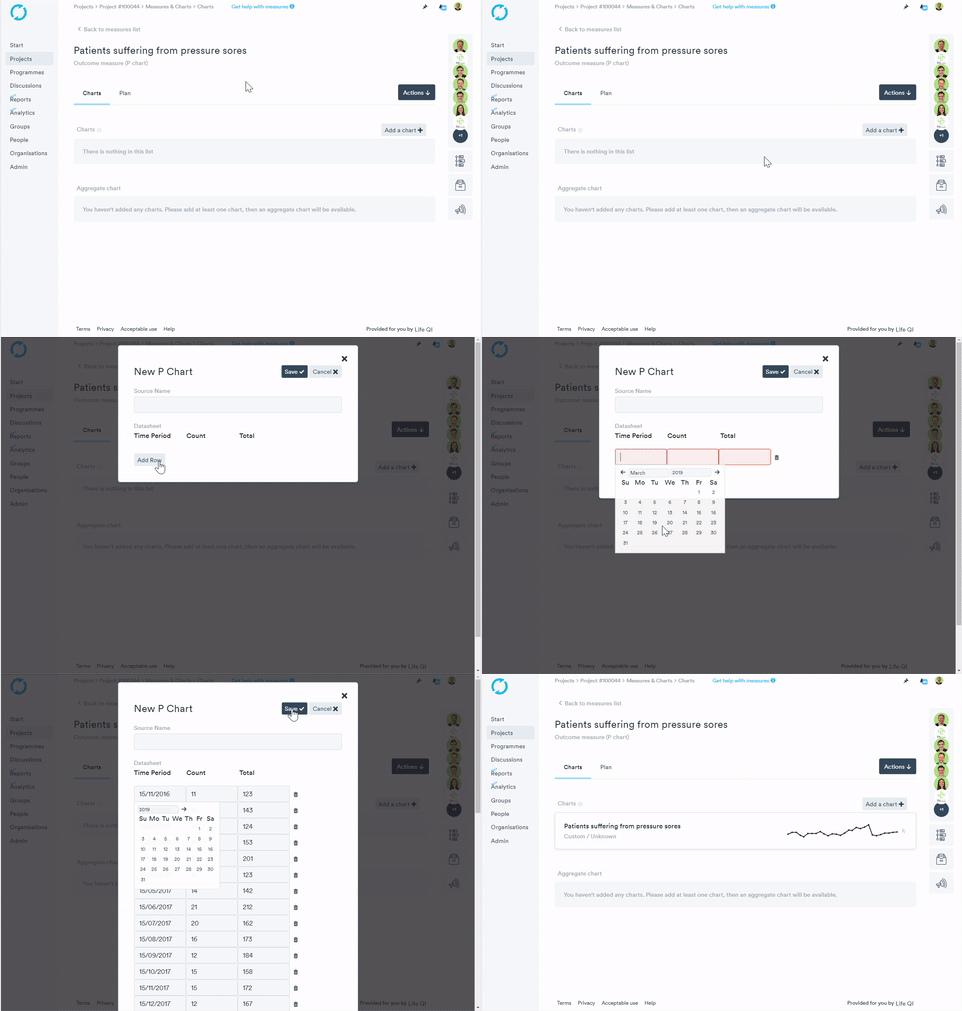
- Go to the chart in LifeQI and a click Edit.
- Click Add Row
- In the first cell of the left hand column, right-click and select 'paste'. All of the data will now appear in order.
Tip: for those receiving their data in an Excel spreadsheet - if you receive your data in the wrong order (i.e. in rows, rather than in columns), highlight the data and copy it (Ctrl-C). Select the field that you want to copy the new data into. Then go to the top left of the page and select the drop-down arrow under 'Paste'. Click 'Transpose'. The data will now appear in the correct order.
Copying data from Excel

Pasting data

If you get an error when trying to paste in your data into a Life QI chart, then this is likely to do with how your data is formatted in your spreadsheet.
As shown in the gif above, under the header Copying data from Excel, make sure your data is formatted to how the Life QI chart is expecting it:
- E.g. - Column one - Date, Column two - value 1 (count), Column three - value 2 (total).
- Only the expected data should be copied and pasted into the Life QI chart.
- Make sure there are no extra cells, rows or columns are being copied.
- Make sure the date is formatted correctly to how Life QI is expecting it - dd/mm/yyyy.
Life QI data collection template
We have created an Excel workbook which contains data collection templates per collection frequency and chart types. This will allow you to seamlessly copy your data from the workbook and paste it into a Life QI chart in pre-defined formats.
You can download the workbook, here.