The upper and lower control limits represent the boundaries of what may be considered normal variation for the system. A central line runs between the two, providing a visual reference point from which you can note variation. A data point appearing outside of the limits during the testing phase indicates unusual variation. In addition to which certain patterns of variation also indicate special cause variation.
Learn more about the types of special cause variation
Whilst control limits are set during the Baseline period, if a significant change to the system is observed (usually indicated by the presence of a Special Cause) the control limits can be recalculated to reflect this. A minimum of 3 data points is required to recalculate the control limits, and any less than 10 will trigger a warning that more points are advised.
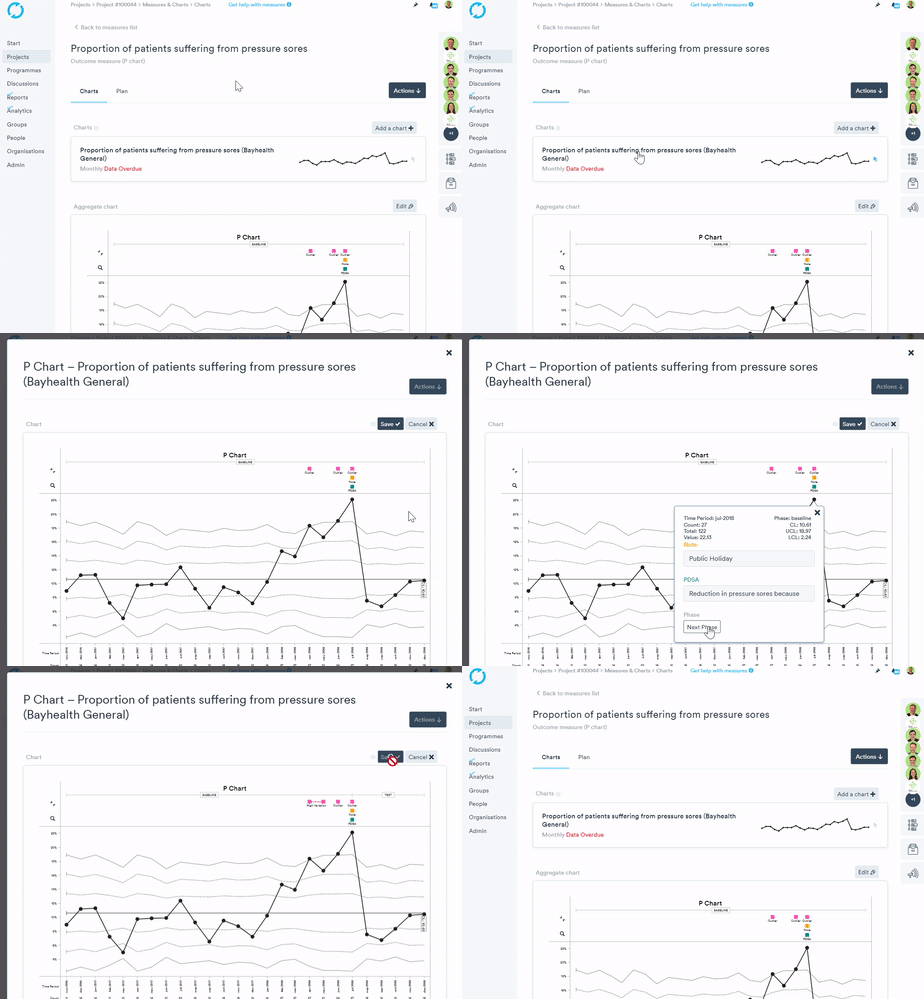
Moving from the Baseline to the test phase
Step 1. Click the chart
Step 2. Click Edit
Step 3. Select the data point where you would like the test phase to begin.
Step 4. Click Next Phase
Step 5. Click Save

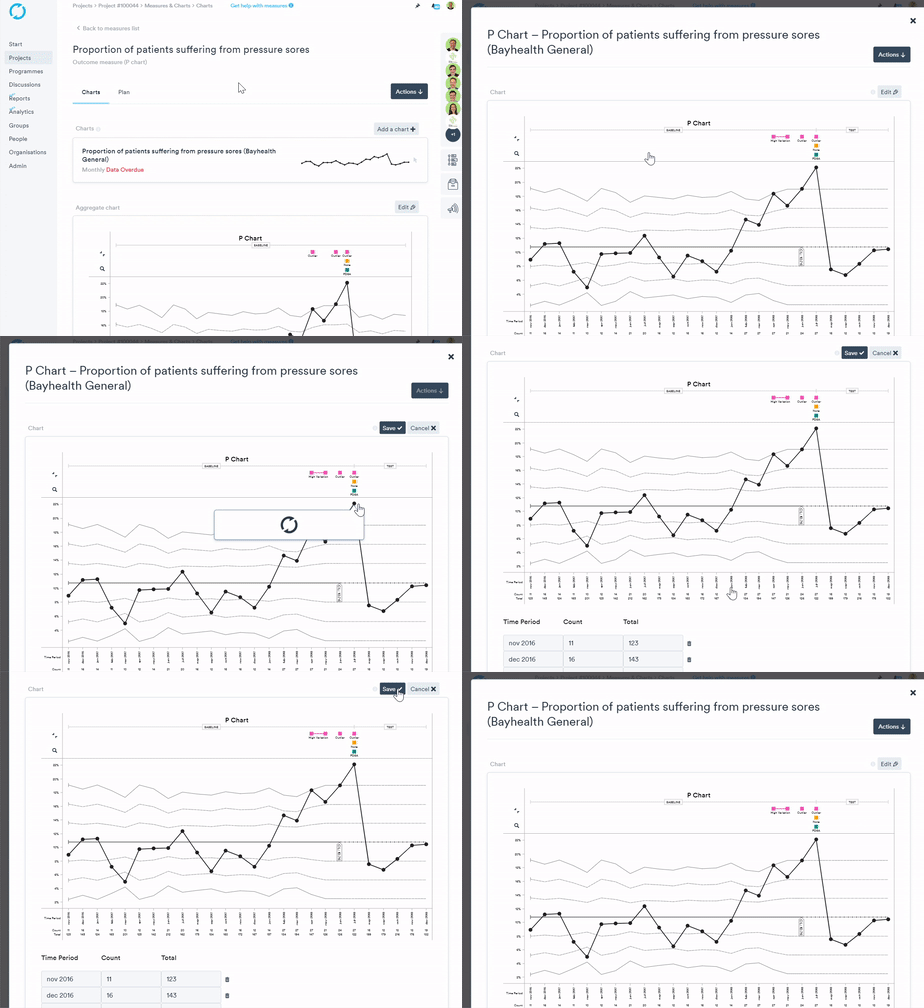
Recalculating the control limits
Please ensure you have moved into the test phase before recalculating the control limits.

Step 1. Click your chart
Step 2. Click Edit
Step 3. Click the data point where you would like to Re-calculate your control limits from.
Step 4. Click Recalculate Control Limits (the control limits will continue to recalculate until you click a data point and click End Limit Recalculation)
Step 5. Click Save.
End Limit Recalculation
Step 1. Click the chart
Step 2. Click Edit
Step 3. Click a data point that is at least 3 data points away from the point where you started to recalculate the control limits.
Step 4. Click End Limit Recalculation
Step 5. Click Save.
Removing the calculation
The control limit recalculation can be removed by selecting 'Reset Limit Calculations', which will revert them to the previous (projected) values.