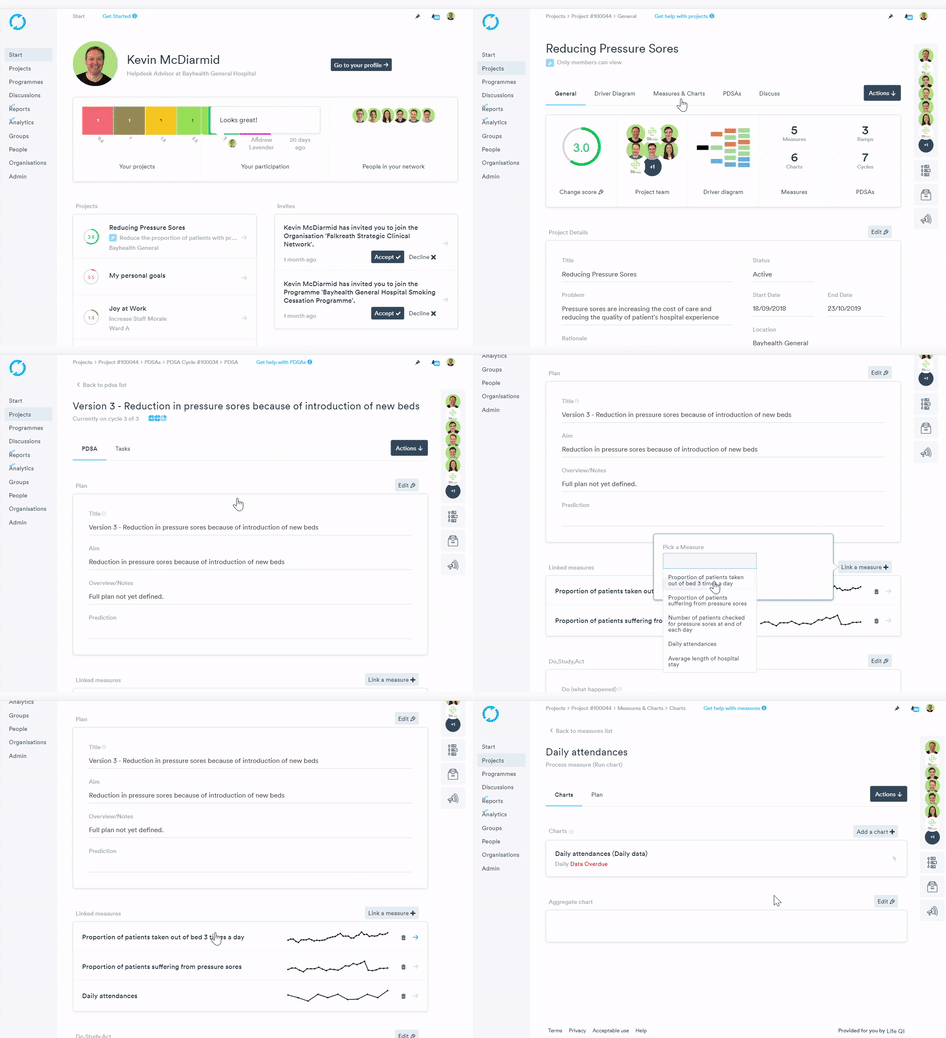
Adding and linking a PDSA cycle to a chart
On Life QI, both Statistical Process Control (SPC) charts and Run charts are used to plot and evaluate the results of a Plan Do Study Act (PDSA) cycle.
To allow you to visualise this linkage you can plot a PDSA cycle on a chart to show when a PDSA cycle began.
Linking a PDSA cycle to a Measure
In the Plan section of your PDSA cycle there is a field select the Measures that will be used to determine if the prediction succeeds.
To link a project Measure to your PDSA cycle:
1. Open the PDSA cycle you wish to add a Measure(s) to.
2. Click the 'Link a measure' button.
3. Select the required Measure from the dropdown list.
4. Click Link Measure

Adding a PDSA cycle to a Chart
- Click the relevant chart and click 'Edit'.
- Click on the data point against which you wish to plot the PDSA cycle; this is normally the data point that relates to the point in time you starting running the PDSA cycle. A pop-out will appear from the data point, click the 'PDSA' drop down.
- Click on the name of the PDSA cycle that you wish to link to.
- Close Pop out and click Save
-gif.gif)
Viewing a linked PDSA cycle from the chart
- PDSA cycles are indicated by green markers above the chart.
- To see the title of the PDSA, click on the green marker.
- A pop-out window with the PDSA title and an option to view the PDSA will appear.