Data collection and measurement are divided into three stages or phases: Baseline, Test and Sustain. This article explains the basics of each phase, as well as instructions on how to move through each phase in Life QI.
Stage 1: Establishing the Baseline (collecting and plotting data before you start your PDSA cycles)
Before you implement your change ideas and PDSA cycles, you need to collect data on how the system is currently working so you can compare your changes against the current norm. This data is presented on the chart as the baseline phase. All charts automatically start in the baseline phase.
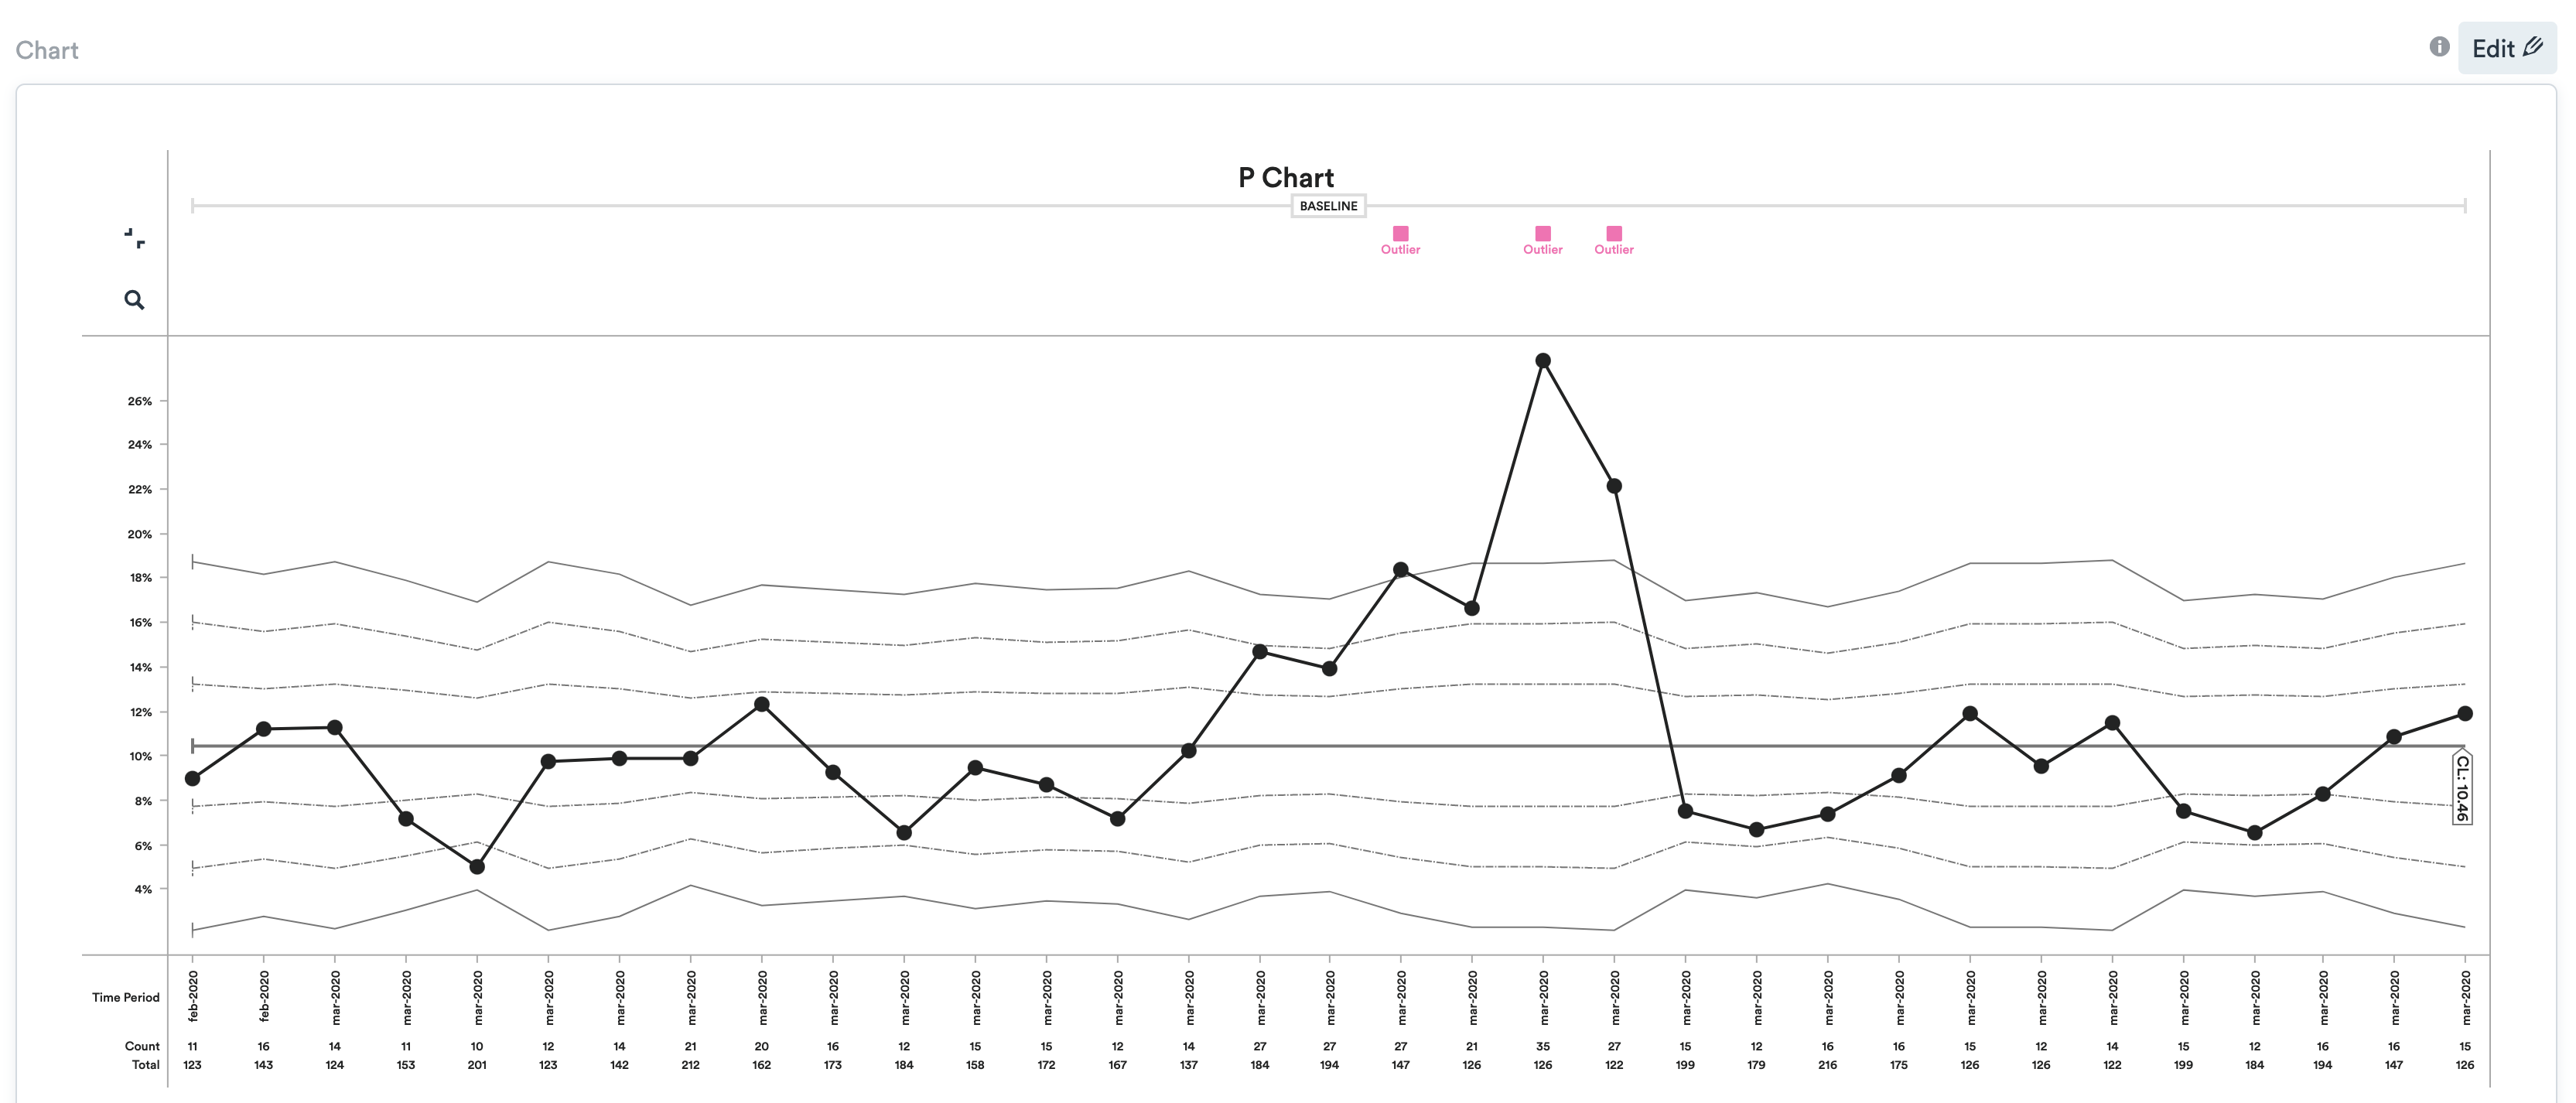
The baseline allows you to establish the upper and lower control limits. These are the boundaries for the maximum and minimum amount of variation that is considered normal. A central line runs between the two, providing a visual reference point from which you can note variation.
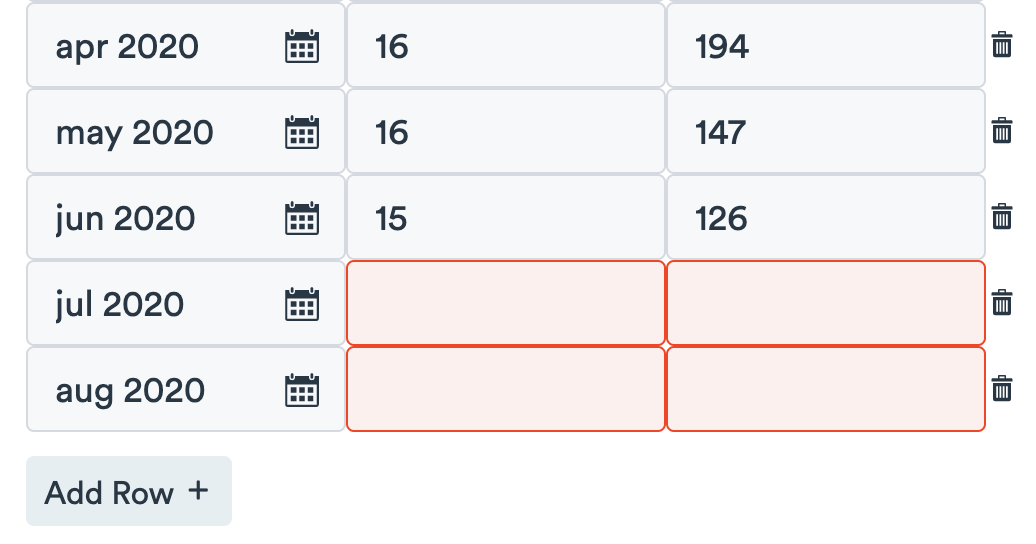
When adding data in the baseline phase, the control limits will be re-calculated as each data point is added, so the limits may change each time you add data.
Once you are ready to move into the testing phase (see Stage 2 below), you can fix the control limits for the baseline and project them forwards into the test phase, allowing you to compare your test results with your baseline data. Whilst this can be done once there are a minimum of three points in the baseline, it is strongly advised that there are 15 or more (a warning will be triggered if there are 10 or less.png)
Stage 2: Testing your change ideas
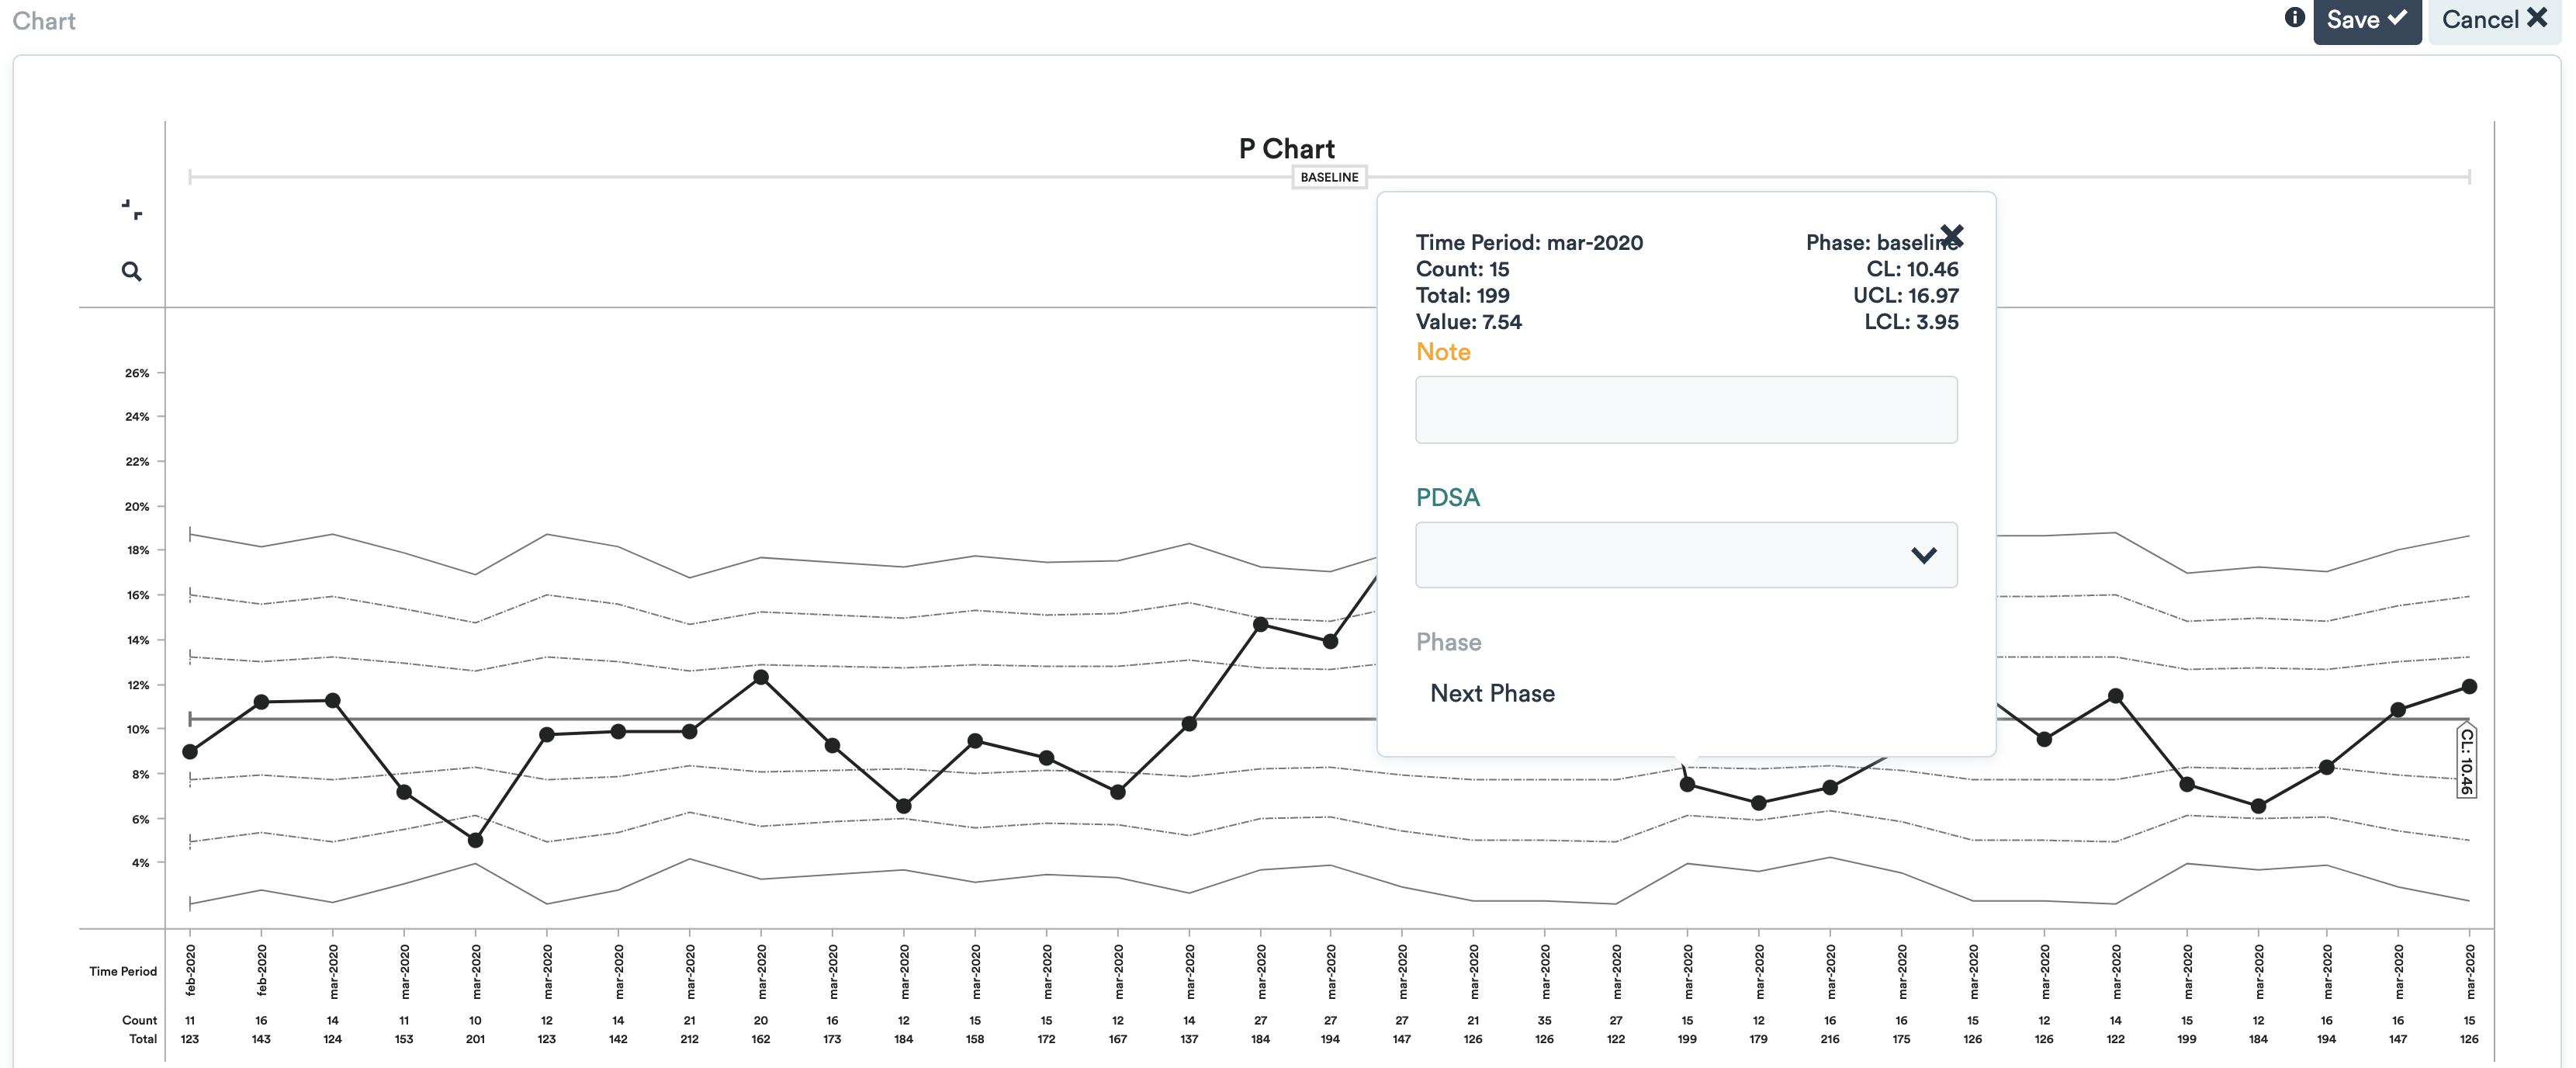
To begin the test phase, click 'Next Phase' in the relevant data point's pop-up (to access this put the chart into edit mode and click on the relevant data point). This will fix the control limits for the Baseline phase at their current values, and project them forwards into the test phase.
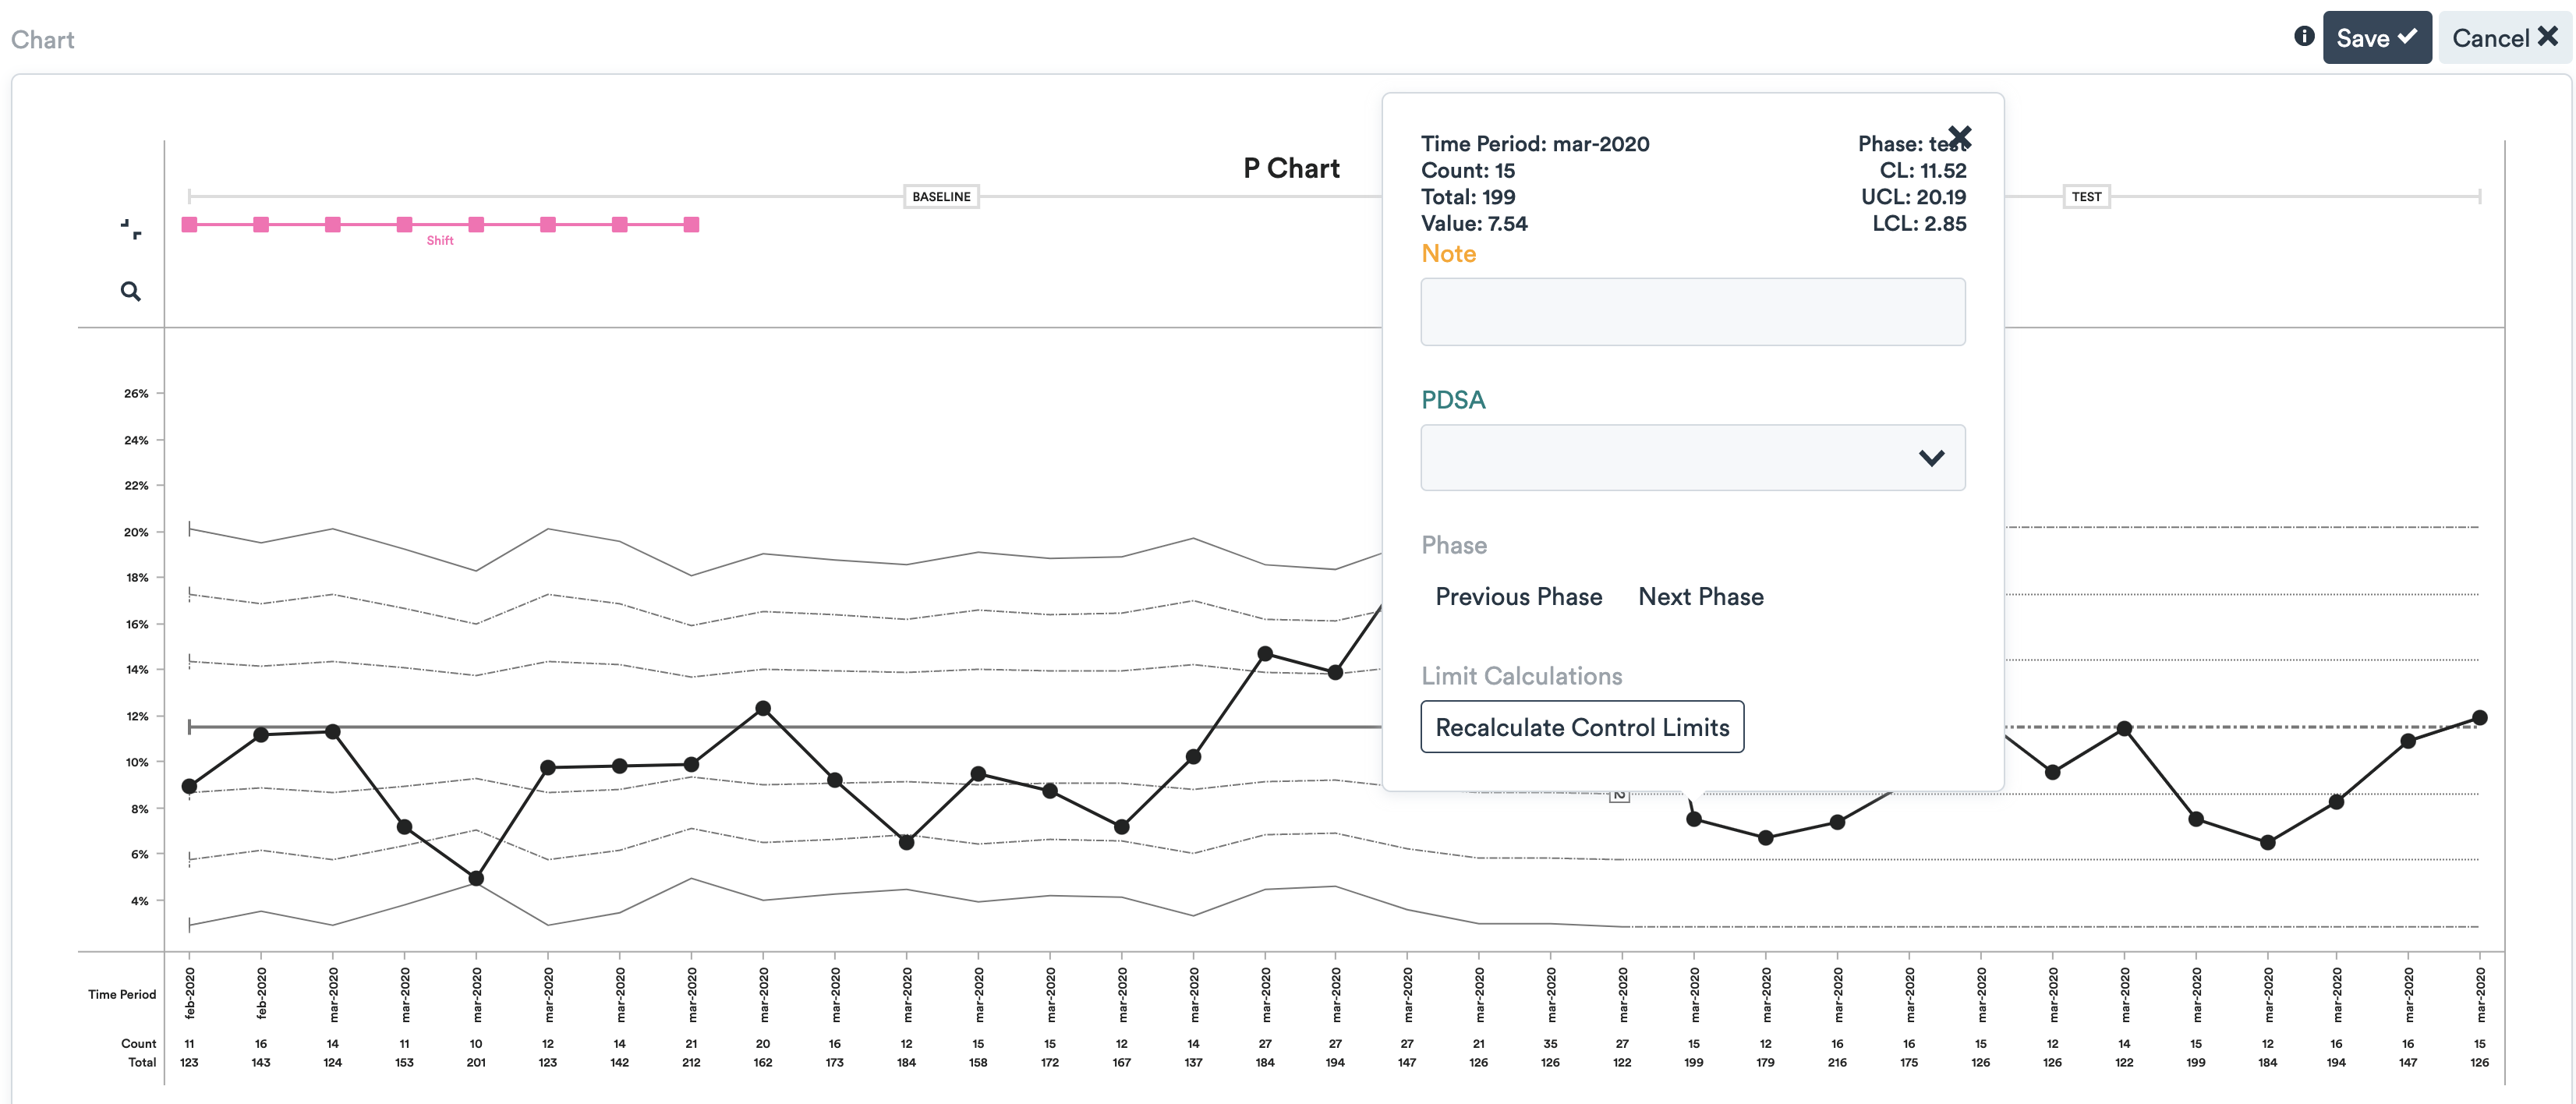
If during the test phase a change to the system is observed (usually indicated by the presence of a Special Cause) which represents a new norm for the system, the control limits can be recalculated to reflect this.
Learn about recalculating control limits
Using the control limits as your guide, you can see just how much change - if at all - your PDSA cycles have had on the system. (You can also plot when you started a PDSA cycle on the chart.) You may notice that there is no notable difference and that none of the variation is significant, or you may see that some data points have moved way out of the control limits, thereby indicating that a potentially significant change has occurred.
If your PDSA cycles have had a positive and lasting effect, you can then move onto the third and final stage of your SPC chart - the sustain phase.
Stage 3: Is the change sustainable?
Before permanently implementing a change or extending it to other parts of the system, you need to make sure that it is sustainable and also check that it is not a product of other unconsidered factors in the system. On the SPC chart this period can be marked as 'Sustain'. Select the data point when the testing phase ended and click 'Next Phase'.
The control limits are not affected by this transition, and will be projected from the last limit calculation. Please note: the phase cannot be changed to Sustain whilst limits are being recalculated, the limit recalculation must be finished first (click 'Finish Limit Calculations').
Learn about recalculating control limits
Once in the sustain phase, continue gathering data as before. If the variation is limited and remains within the control limits, or if it keeps moving in a positive direction, you know that the changes can be implemented permanently.